Run an Application on EC2 and Send Metrics to Amazon Managed Service for Prometheus (AMP)
What’s Amazon Managed Service for Prometheus (Amazon Prometheus / AMP)
Amazon Managed Service for Prometheus is a serverless, Prometheus-compatible monitoring service for container metrics that makes it easier to securely monitor container environments at scale. With AMP, you can use the same open-source Prometheus data model and query language that you use today to monitor the performance of your containerized workloads, and also enjoy improved scalability, availability, and security without having to manage the underlying infrastructure. source
There is a good AWS Blog post that describes the service features:
What if I would like to gather metric without having Kubernetes/ECS cluster?
Most examples use EKS, ECS, or a Kubernetes cluster. But what if you simply want to collect metrics from your application without managing Prometheus yourself, while still letting AWS handle the availability? The idea is straightforward, but it still took me some time to research and test it, so I decided to write down the detailed steps here.
If you would like to do this, you should have:
- Application: Your application should follow the data model supported by Prometheus (for example,
go_gc_duration_seconds_count 62) and expose metrics through an HTTP endpoint such as/metrics. - AWS SigV4 Proxy: When using
remote_write, the AWS SigV4 Proxy signs incoming HTTP requests and forwards them to the host specified in theHostheader. - Standard Prometheus Server (or another metrics agent): Prometheus needs to scrape your application endpoint (
/metrics) and ship metrics to the URL specified in theremote_writesection.
Overview
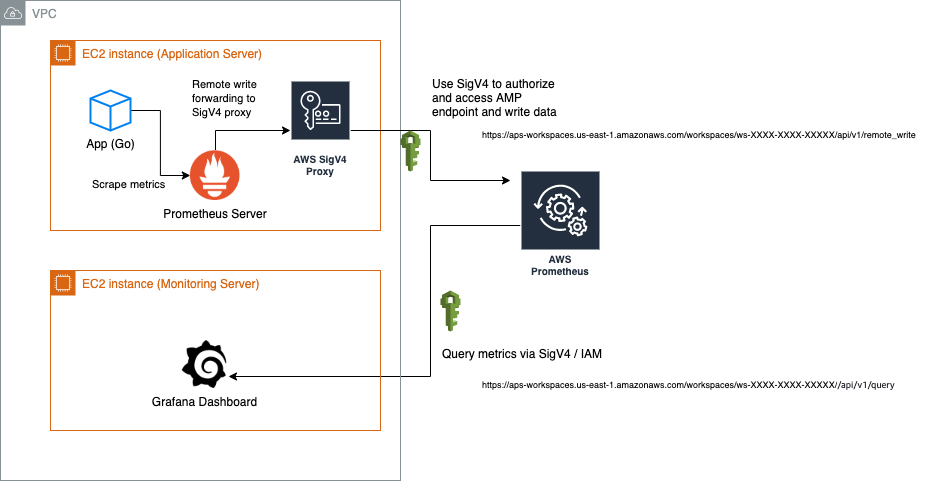
- Monitoring Server (let’s say it is EC2 instance A): This instance is running Grafana dashboard to see my metrics
- Application Server (let’s say it is EC2 instance B): The instance is running my application and standard Prometheus(gathering metrics)
- A workspace in Amazon Managed Service for Prometheus (AMP) in
us-east-1: Used to receive metrics and provide a stable query endpoint so Grafana can query them
Configuration steps
To demonstrate the entire working flow, I am going to use several docker images to quickly show how to do that. If you requires to run standalone application, you can use those Docker images, or build the binary by yourself by referencing the Dockerfile and documentations.
- prom/prometheus: Standard Prometheus container image, binaries can be found on official documentation here.
- grafana/grafana: Grafana dashboard
- prometheus-golang: Sample application from sysdig for Prometheus metrics. (Source)
- public.ecr.aws/aws-observability/aws-sigv4-proxy: AWS SigV4 Proxy to sign incoming HTTP requests and forward them
1) Create a workspace in Amazon Prometheus (AMP)
If you got the preview access, the first step is to create a workspace in Amazon Prometheus:
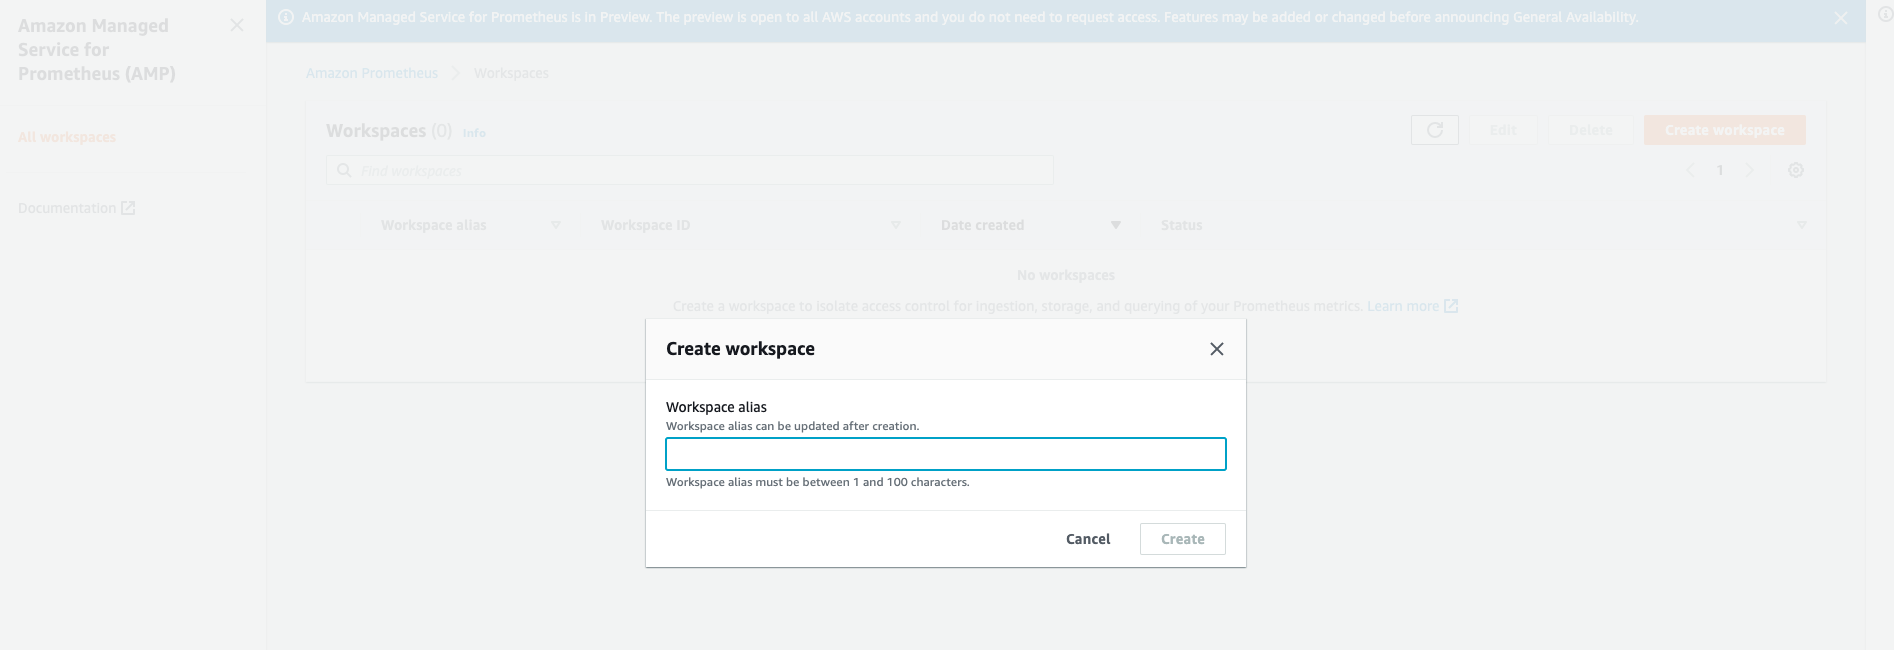
So far it is simple and you can easily click one button to complete the creation. It usually takes few minutes as it was doing provisioning in the backend.
2) Set up IAM user/role permission for your Grafana dashboard
Access to Amazon Managed Service for Prometheus actions and data requires credentials as AMP is using IAM for ensuing the data security. Therefore, it is required to have SigV4/IAM authentication when accessing the endpoint as it provides a consistent query endpoint for your AMP resource once you created a workspace. For example, the AMP resource in us-east-1 region can provide endpoint below:
- https://aps-workspaces.us-east-1.amazonaws.com/workspaces/ws-XXXXXXXX-XXXX-XXXX-XXXX-XXXXXXXXXXXX/api/v1/query
When adding the data source in my Grafana dashboard, it needs to follow the authentication model to access the data. To provide the access for my dashboard, in the example, I simply created a IAM user(amp-gra-user) with plain Access Key & Secret Key. To esnure it has permission to access AMP resource, I attached managed policy AmazonPrometheusQueryAccess with following rules to provide readable access:
{
    "Version": "2012-10-17",
    "Statement": [
        {
            "Action": [
                "aps:GetLabels",
                "aps:GetMetricMetadata",
                "aps:GetSeries",
                "aps:QueryMetrics"
            ],
            "Effect": "Allow",
            "Resource": "*"
        }
    ]
}
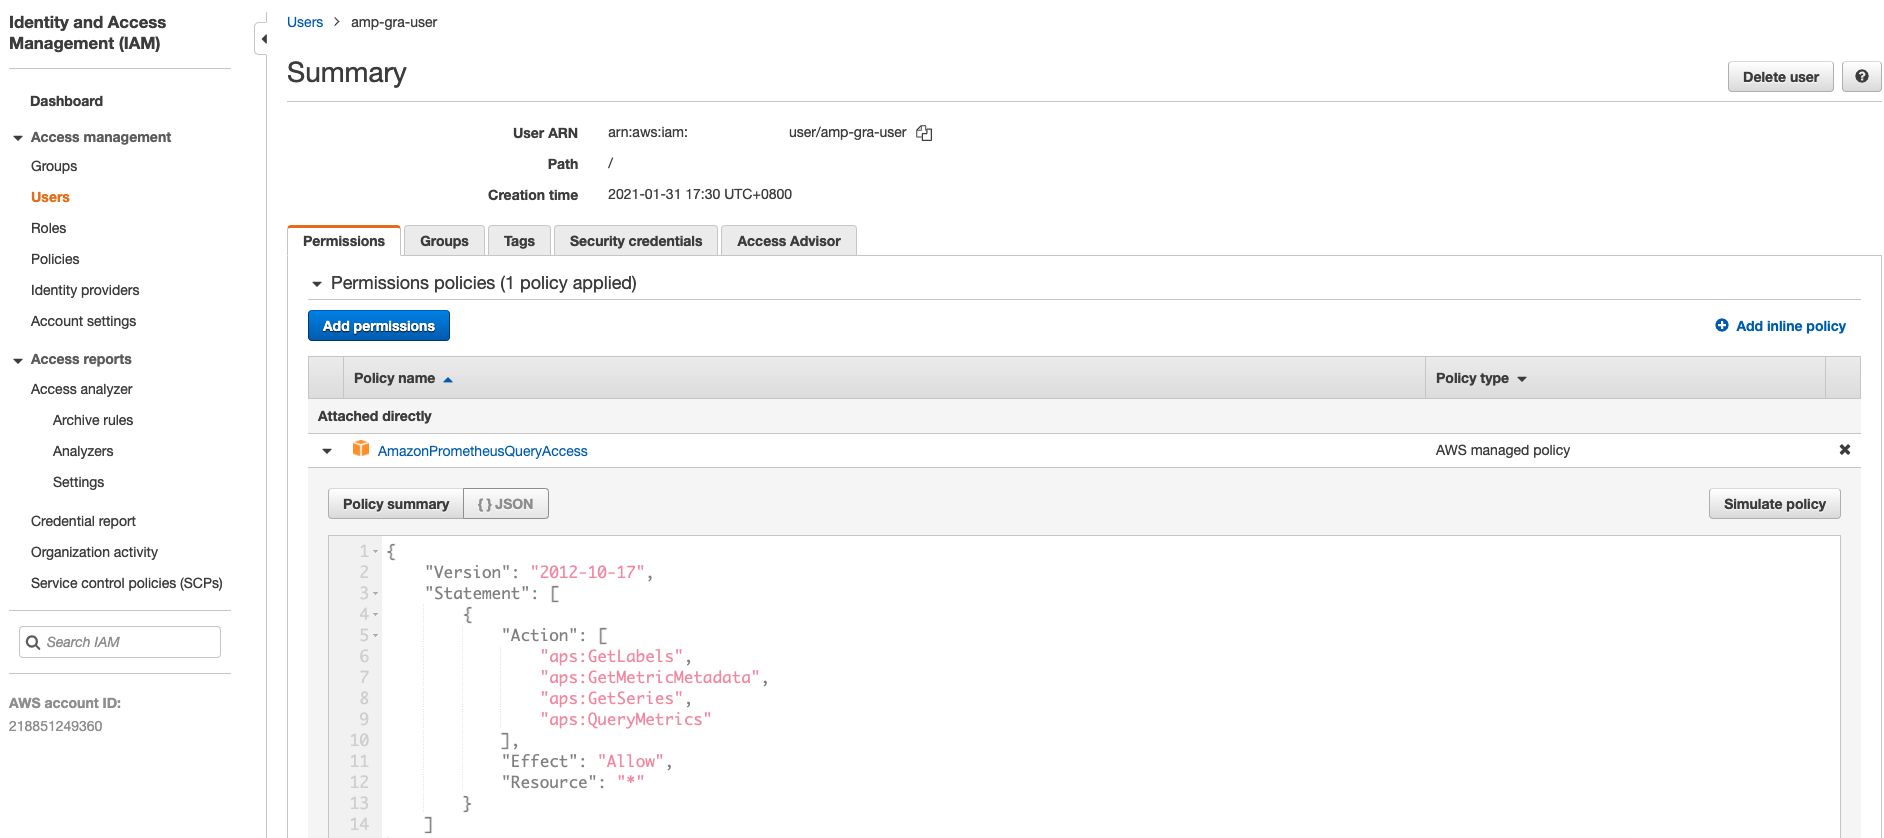
You still can use IAM role/attached EC2 IAM role as Grafana generally can use those permission if enabled loading AWS SDK config, as in my next step.
As the managed policy might be changed once the service is generally available (GA), please refer to the Amazon Prometheus document - IAM permissions and policies to get more detail.
3) Run Grafana dashboard on my monitoring server (EC2 instance A)
This step I used Docker to run my Grafana dashboard. As Amazon Managed Service for Prometheus is integrated with AWS Identity and Access Management (IAM) to ensure that all calls to Prometheus APIs, such as query and ingest, are secured with IAM credentials.
By default, the Prometheus data source in Grafana assumes that Prometheus requires no authentication. To enable Grafana to take advantage of AMP authentication and authorization capabilities, you will need to enable SigV4 authentication support in the Grafana data source. Reference
To enable SigV4 on Grafana, I run my Grafana with the AWS_SDK_LOAD_CONFIG and GF_AUTH_SIGV4_AUTH_ENABLED environment variables set to true. The GF_AUTH_SIGV4_AUTH_ENABLED environment variable overrides the default configuration for Grafana to enable SigV4 support. sigv4_auth_enabled
$ docker run -d \
    -p 3000:3000 \
    --name=grafana \
    -e "GF_AUTH_SIGV4_AUTH_ENABLED=true" \
    -e "AWS_SDK_LOAD_CONFIG=true" \
    grafana/grafana
Once the Grafana is up and running, the next thing is that go to the AMP console then copy and paste the endpoint URL in your Grafana. You can find section Endpoint - remote write URL & Endpoint - query URL in the console:

Open http://localhost:3000 (or http://<Grafana Dashboard IP>:3000), you should see the login page, use the following default username and password to enter the Dashboard:
Username: admin
Password: admin
You can use same password if you are doing testing purpose. (Please change the password if you are running dashboard in production environment due to it will have security concern without changing it, any attacker can enter and view your metrics by using default passwords.)
The Grafana requires to use query URL to read the metric, so go to the Grafana Dashboard and add a new Data Source. You can find the setting in the left navigation bar:
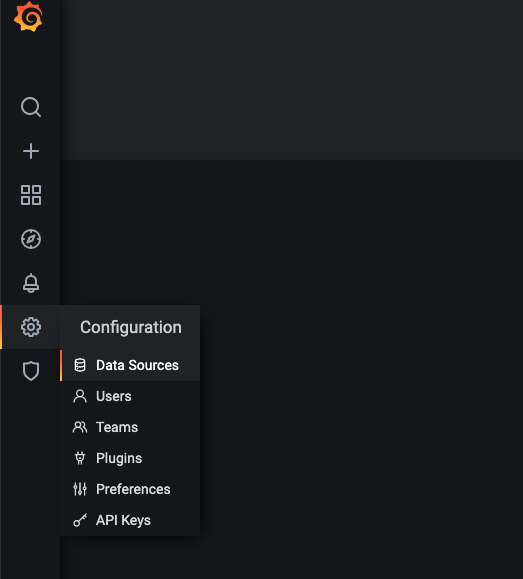
Select ‘Prometheus’ as new data source to add, fill the several information as below:
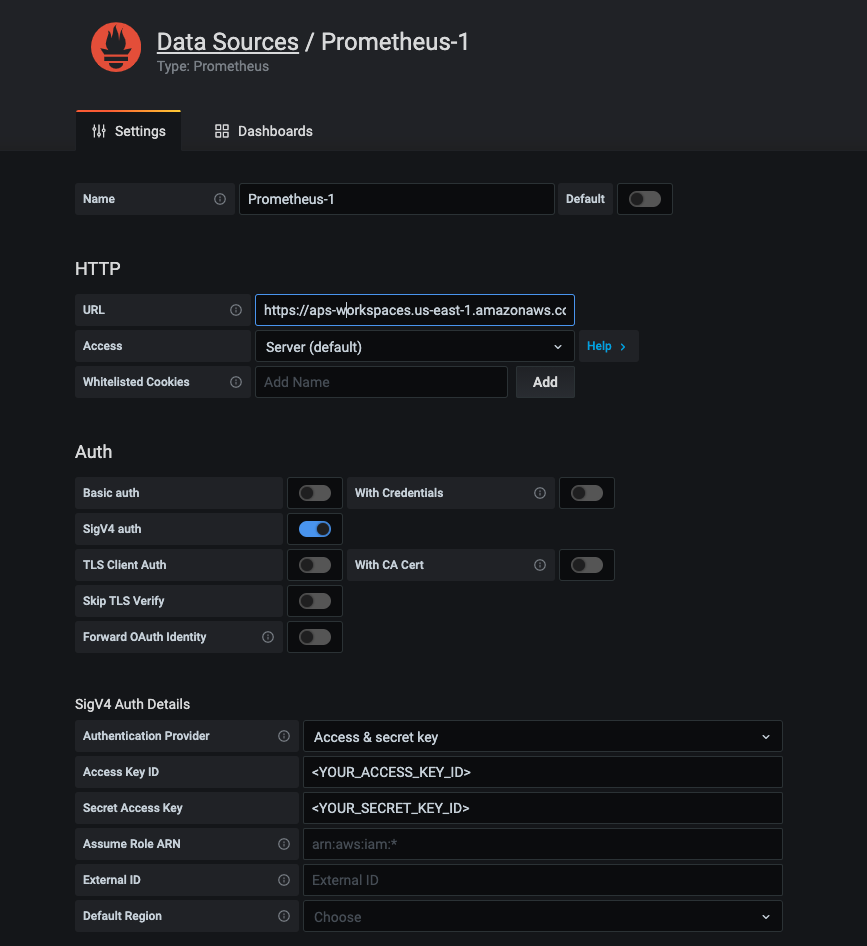
- HTTP > URL: fill the endpoint URL you just copied (Endpoint - query URL), please remove the
/api/v1/querystring that is appended to the URL, because the Prometheus data source will automatically append it. For example:- Endpoint (query URL):
https://aps-workspaces.us-east-1.amazonaws.com/workspaces/ws-XXXXX-XXXX-XXX-XXXX-XXXXXX
- Endpoint (query URL):
- Auth > SigV4 auth: Enable the selection
- SigV4 Auth Details: Select
Authentication Provider(Using Access & Secret key or else). In my testing I was fillingAccess Key ID&Secret Access Keywith the credential of my IAM User (amp-gra-user).
Then click Save & Test, if everything works fine, you will see the message Data source is working:

If not and shows other error messages, please refer to the following documentation to do troubleshooting:
At this step we can ensure Grafana can query our metrics on AMP, but there has no data point yet, so the next step is to gather and write metrics to AMP.
4) On application server (EC2 instance B, with private IP address: 172.31.21.133)
I attached an IAM Role to my EC2 instance B with following IAM policy (To write metric, at least to ensure you have aps:RemoteWrite permission, as AmazonPrometheusRemoteWriteAccess), this can allow AWS SigV4 proxy can use the permission and writes metrics to AMP:
{
    "Version": "2012-10-17",
    "Statement": [
        {
            "Effect": "Allow",
            "Action": [
                "aps:RemoteWrite",
                "aps:QueryMetrics",
                "aps:GetSeries",
                "aps:GetLabels",
                "aps:GetMetricMetadata"
            ],
            "Resource": "*"
        }
    ]
}
When your Prometheus server is ingesting metrics on your EC2 instance B, to secure the ingestion, it is requires to use SigV4 authentication when writing metrics to AMP. However, the Prometheus server generally only can use basic auth to do Authorization for remote_write. Therefore, it is required to run a SigV4 proxy to provide access on port 8005 when forwarding remote write traffic.
$ docker run -d -p 8005:8005 public.ecr.aws/aws-observability/aws-sigv4-proxy:1.0 --name aps --region us-east-1 --host aps-workspaces.us-east-1.amazonaws.com --port :8005
So the proxy will provide service on port 8005 and can be accessed via localhost:8005 or 172.31.21.133:8005.
Note: If you are not running resource in us-east-1 region, replace option --region us-east-1 and --host aps-workspaces.us-east-1.amazonaws.com as your own.
Once the SigV4 proxy is up and running, I am going to run a sample Go applcation:
$ git clone https://github.com/sysdiglabs/custom-metrics-examples
$ docker build custom-metrics-examples/prometheus/golang -t prometheus-golang
$ docker run -d --rm --name prometheus-golang -p 80:8080 prometheus-golang
The Go application will expose the metric with path/metrics, so I can query them if using curl:
$ curl http://localhost/metrics | head

# HELP go_gc_duration_seconds A summary of the GC invocation durations.-     0
# TYPE go_gc_duration_seconds summary
go_gc_duration_seconds{quantile="0"} 2.9336e-05
go_gc_duration_seconds{quantile="0.25"} 3.1688e-05
go_gc_duration_seconds{quantile="0.5"} 3.459e-05
go_gc_duration_seconds{quantile="0.75"} 4.1515e-05
go_gc_duration_seconds{quantile="1"} 8.7687e-05
go_gc_duration_seconds_sum 0.00251097
go_gc_duration_seconds_count 62
...
5) Set up the Prometheus server to collect metrics
I created a configuration for Prometheus and scrape metric for Prometheus server itself (http://localhost:9090/metrics) and my Go application (Go application will expose metric through 172.31.21.133:80/metrics):
- remote_write: The section below can send metric to the remote endpoint. In this case, the url need to be specified through SigV4 proxy.
[conf.yml]
#global config
global:
  scrape_interval:     15s
  evaluation_interval: 5s
  scrape_timeout:     10s
  external_labels:
    monitor: 'monitor'

# Scrape configs only contain one scrape target
scrape_configs:
  - job_name: 'prometheus'
    # Override the global default and scrape targets from this job every 5 seconds.
    scrape_interval: 5s
    static_configs:
      - targets: ['localhost:9090', '172.31.21.133:80']
remote_write:
  - url: 'http://172.31.21.133:8005/workspaces/ws-XXXXXX-XXXX-XXX-XXXX-XXXXXXX/api/v1/remote_write'
Then, start the Prometheus server to scrape metric:
$ docker run \
     -p 9090:9090 \
     -v $PWD/conf.yml:/etc/prometheus/prometheus.yml \
     prom/prometheus
Once the Prometheus server is up and running, you would expect to see targets and know the health status:

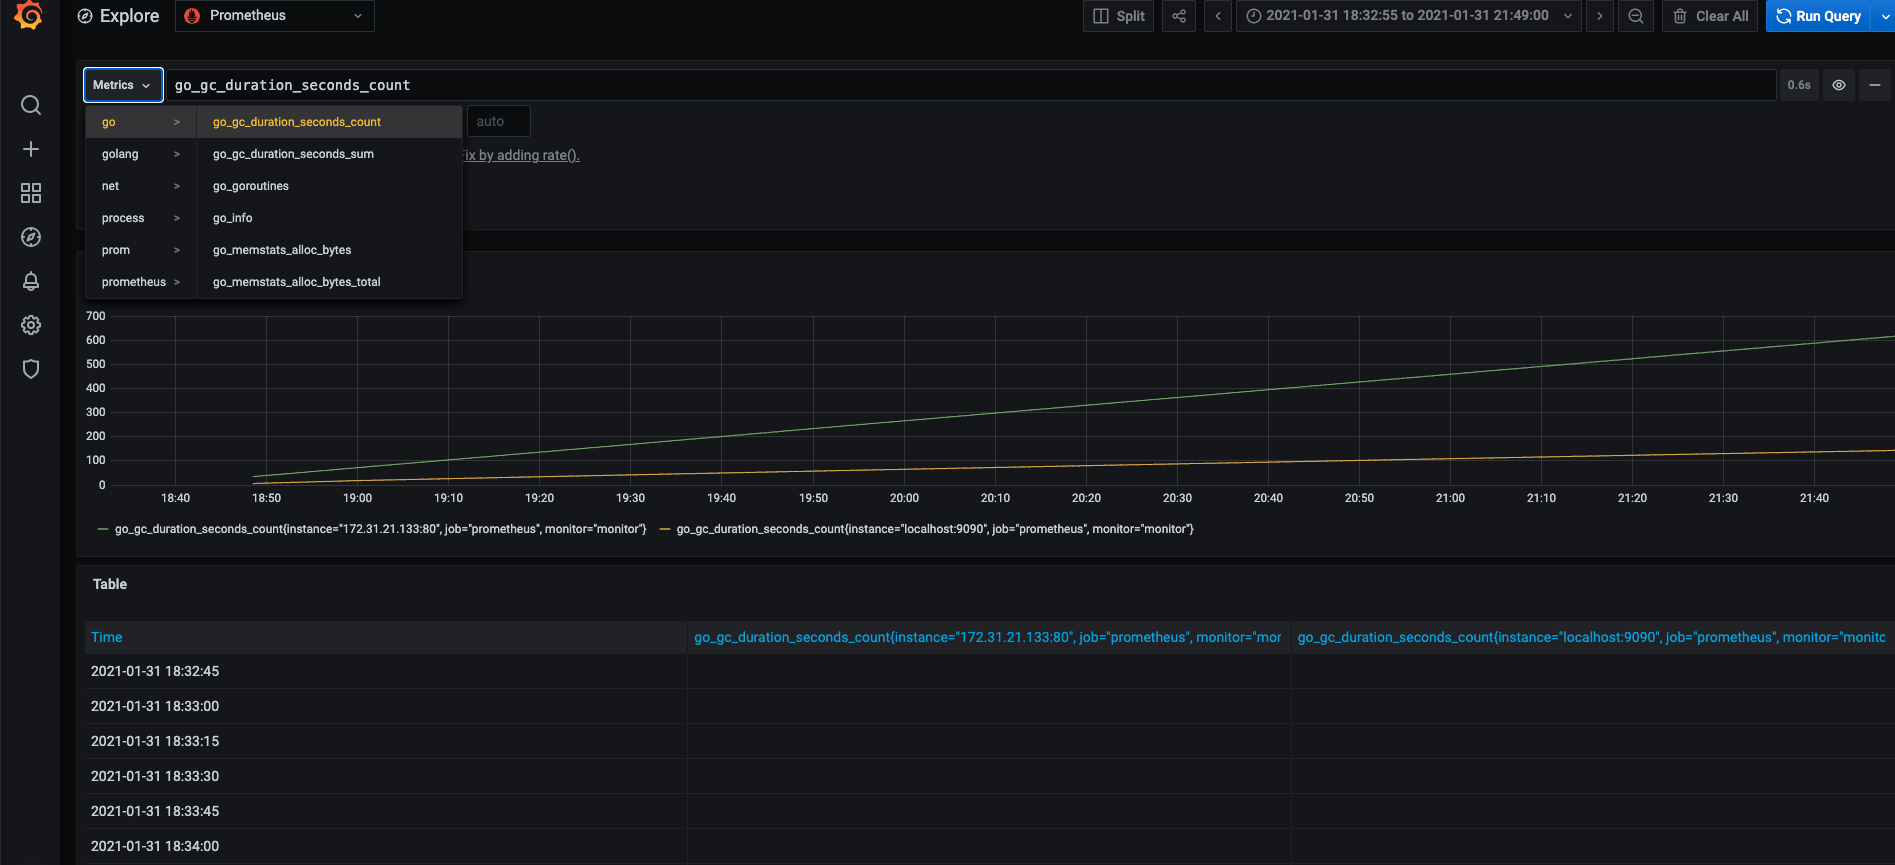
5) View the metric !
Right now, if the Prometheus server can correctly write metric through AWS SigV4 Proxy, you would expect to view the metrics on Grafana dashboard:
Troubleshooting
How to use curl to query my Amazon Prometheus to check if the connectivity, or, IAM authentication is working or not?
To test the Sigv4, you can run the proxy and test the function with curl command. If you also would like to specify the IAM credential, choose either one of method to test the proxy and see if it can route the traffic for you:
# Env vars
$ docker run --rm -ti \
  -e 'AWS_ACCESS_KEY_ID=<YOUR ACCESS KEY ID>' \
  -e 'AWS_SECRET_ACCESS_KEY=<YOUR SECRET ACCESS KEY>' \
  -p 8005:8005 \
  public.ecr.aws/aws-observability/aws-sigv4-proxy:1.0 --name aps --region us-east-1 --host aps-workspaces.us-east-1.amazonaws.com --port :8005

# Shared Credentials
$ docker run --rm -ti \
  -v ~/.aws:/root/.aws \
  -p 8005:8005 \
  -e 'AWS_PROFILE=<SOME PROFILE>' \
  public.ecr.aws/aws-observability/aws-sigv4-proxy:1.0 --name aps --region us-east-1 --host aps-workspaces.us-east-1.amazonaws.com --port :8005
Once the aws-sigv4-proxy is up and running, you can simply to use curl to test the local endpoint:
- An example with normal request but did not have query:
$ curl http://localhost:8005/workspaces/ws-XXXXXXXX-XXXX-XXXX-XXXX-XXXXXXXXXXXX/api/v1/query -vvv

*   Trying 127.0.0.1...
* TCP_NODELAY set
* Connected to localhost (127.0.0.1) port 8005 (#0)
> GET /workspaces/ws-XXXXXXXX-XXXX-XXXX-XXXX-XXXXXXXXXXXX/api/v1/query HTTP/1.1
> Host: localhost:8005
> User-Agent: curl/7.53.1
> Accept: */*
>
< HTTP/1.1 400 Bad Request
< Content-Type: application/json
< Date: Tue, 09 Feb 2021 15:02:56 GMT
< Server: amazon
< X-Amzn-Requestid: XXXXXXXX-XXXX-XXXX-XXXX-XXXXXXXXXXXX
< Content-Length: 125
<
* Connection #0 to host localhost left intact
{"status":"error","errorType":"bad_data","error":"invalid parameter 'query': 1:1: parse error: no expression found in input"}
- An example with normal request by feeding query according to HTTP API:
$ curl http://localhost:8005/workspaces/ws-XXXXXXXX-XXXX-XXXX-XXXX-XXXXXXXXXXXX/api/v1/query?query=up -vvv

*   Trying 127.0.0.1...
* TCP_NODELAY set
* Connected to localhost (127.0.0.1) port 8005 (#0)
> GET /workspaces/ws-XXXXXXXX-XXXX-XXXX-XXXX-XXXXXXXXXXXX/api/v1/query?query=up HTTP/1.1
> Host: localhost:8005
> User-Agent: curl/7.53.1
> Accept: */*
>
< HTTP/1.1 200 OK
< Content-Type: application/json
< Date: Tue, 09 Feb 2021 15:10:49 GMT
< Server: amazon
< X-Amzn-Requestid: XXXXXXXX-XXXX-XXXX-XXXX-XXXXXXXXXXXX
< Content-Length: 63
<
* Connection #0 to host localhost left intact
{"status":"success","data":{"resultType":"vector","result":[]}}
- An example with failed response due to lack of IAM permission(
aps:QueryMetrics) for my IAM user/role:
$ curl http://localhost:8005/workspaces/ws-XXXXXXXX-XXXX-XXXX-XXXX-XXXXXXXXXXXX/api/v1/query -vvv

*   Trying 127.0.0.1...
* TCP_NODELAY set
* Connected to localhost (127.0.0.1) port 8005 (#0)
> GET /workspaces/ws-XXXXXXXX-XXXX-XXXX-XXXX-XXXXXXXXXXXX/api/v1/query HTTP/1.1
> Host: localhost:8005
> User-Agent: curl/7.53.1
> Accept: */*
>
< HTTP/1.1 403 Forbidden
< Content-Length: 200
< Content-Type: application/json
< Date: Tue, 09 Feb 2021 15:07:55 GMT
< Server: amazon
< X-Amzn-Errortype: AccessDeniedException
< X-Amzn-Requestid: xxxxxxxx-xxxx-xxxx-xxxx-xxxxxxxxxxxx
< X-Amzn-Requestid: xxxxxxxx-xxxx-xxxx-xxxx-xxxxxxxxxxxx
<
* Connection #0 to host localhost left intact
{"Message":"User: arn:aws:iam::111111111111:user/myIAMUser is not authorized to perform: aps:QueryMetrics on resource: arn:aws:aps:us-east-1:111111111111:workspace/ws-XXXXXXXX-XXXX-XXXX-XXXX-XXXXXXXXXXXX"}
Conclusion
In this article, it shows a example to use Amazon Managed Service for Prometheus (AMP) to gather metrics when running standalone application on EC2 instance, rather than having Kubernetes to deploy. As it might be difficult to understand what things need to be noticed, so I shared configuration and steps. Giving the overview and share some tips you have to know if you are trying to push metrics to AMP.
If you are interested to learn more, I also try to summarize a couple of things you may want to know as an online learning material, feel free to click the link to get more detail:
References
Share on
Twitter Facebook LinkedInIs that useful? Let me know or buy me a coffee
 一次性支持 (ECPay)


Leave a comment